Seven Year Cycle Update
Walking the Bull/Bear line into decision-time

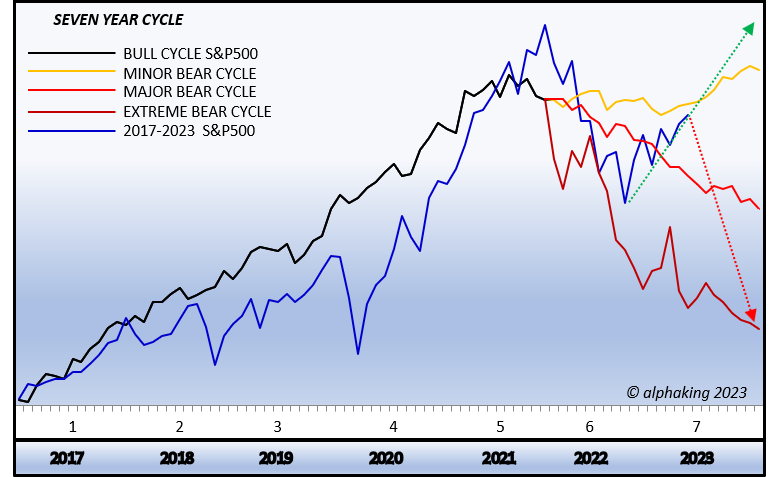
The seven year cycle chart shown above uses monthly closing data. With April now behind us, I thought this a good time to provide an update on the cycle, as stocks sit at an incredibly important spot regarding the end of the bear market, versus another round of collapse phase into late 2023.
The basis of the cycle goes way back and mentioned in the bible, with five years of feast (bull market) followed by two years of famine (bear market.) The expected cycle lines are the average of all past seven year cycles over the past century.
The current cycle began in 2017, with the bull phase slated to end in late 2021. While the S&P500 cycle (blue line) continued to run a few months more than expected when FED-Chair Powell left interest rates super low when he should have been raising them because he wanted to get re-elected to a second term. Once he was given the nod on a second term as FED-Chair he started the rate-hike cycle and the S&P500 played catch up to the downside, quickly matching the expected maroon line of the major bear phase.
The S&P500 bounced at a level highlighted by the bear cycle as where it should bounce, albeit a few months later than expected per the maroon line. Now the question becomes has the bear cycle ended to now follow the amber colored line of minor bear, or will the S&P500 continue to follow the maroon major bear line once the current rally resumes?
While both are possible, gun to head I’d say stocks are likely to begin falling hard soon to play catch up once again to the maroon line.
The green uptrend arrow highlights the demarcation line between the two scenarios.
The blue line of the current S&P500 cycle since the bear phase began looks, to me, like the 1929-1930 topping process ahead of the depression collapse into an eventual 1933 low. If so, the maroon line says the next collapse doesn’t have to be as bad what happened back then, but it certainly could be.
So, stocks are at a critical juncture, where an acceleration of price movement is expected. The direction of that acceleration likely delivers a massive victory to either the bulls or the bears. The month of May looks like the key month where that decision is made, although it is how May ends in regards to the green uptrend arrow that is the ‘tell,’ where any swoon attempt earlier in the month may see buyers step forward to save the day. A bad close in May suggests expecting and preparing for the worst-case outcome is called for.
I plan to update the cycle again at the end of May, and then again at the end of June, when a full update on the strategies shown in the AK book will be published. May/June should be massive for every investor, including those trading the AK way.
See you then!